Once Rainbow-OS could compile C and run it in Ring 3, the obvious next question
was: how do you watch one of those programs run? This update adds an
in-OS debugger — debug myprog.bin at the shell
drops you into an interactive prompt where you can set breakpoints, single-step,
inspect registers and memory, disassemble, and walk the call stack. No host
tooling, no GDB; the debugger lives inside the operating system and debugs the
operating system’s own programs.
The trick: the debugger lives in the trap handlers
The whole design hinges on two CPU exceptions that x86 has had since the
386. A breakpoint instruction (int3, the single byte
0xCC) raises #BP. The EFLAGS Trap Flag
makes the CPU raise #DB after every single instruction. Wire a
handler to each, and the handler is the debugger.
When a debugged program hits a breakpoint or finishes a step, the CPU traps
from Ring 3 into the kernel, lands in the handler, and the handler simply opens a
command prompt — reading keys, printing registers, waiting for you. The
paused program’s entire state (every register, its EIP, its flags) is sitting
right there in the saved interrupt frame. When you type c or
s, the handler tweaks that frame and returns; the iret
resumes the program exactly where it left off. Pausing a program turned out to be
nothing more than not returning from an interrupt yet.
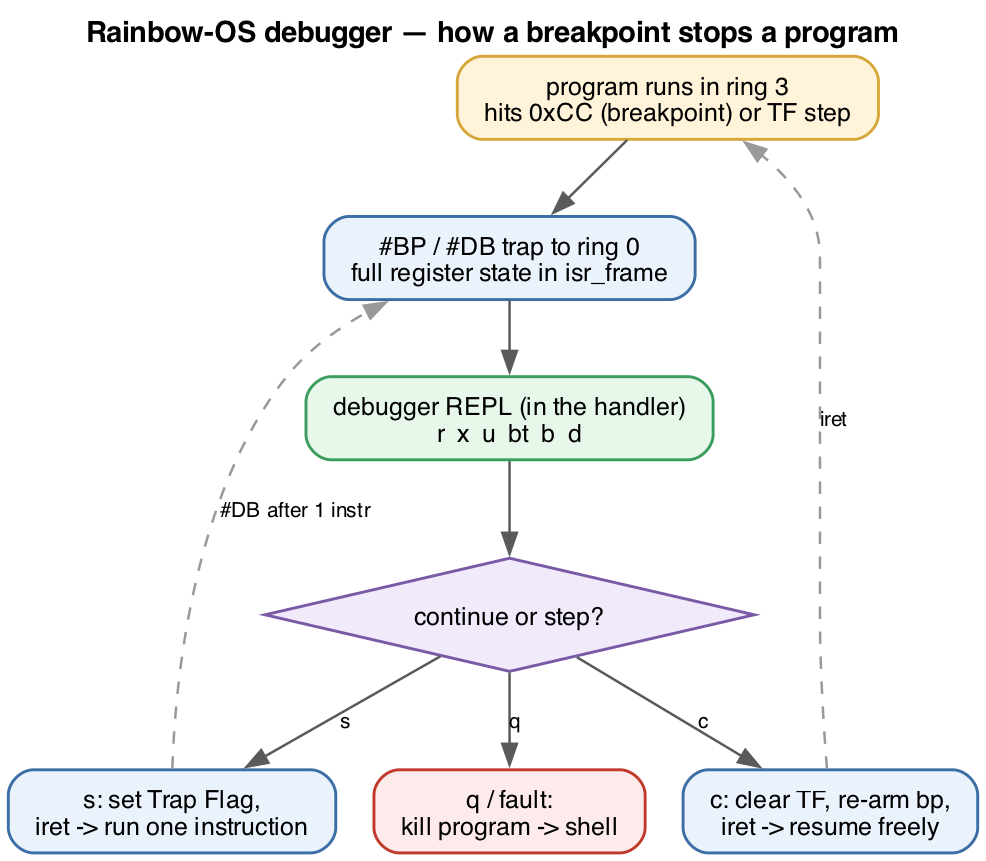
Breakpoints, the classic dance
Setting a breakpoint means overwriting the target byte with 0xCC
and remembering the original. When execution reaches it, #BP fires,
the debugger backs EIP up to the breakpoint and restores the real byte so you see
(and can step) the true instruction. Continuing past a breakpoint you want to
keep is the fiddly part every debugger has to solve: restore the real
byte, set the Trap Flag, execute exactly one instruction, catch the resulting
#DB, re-arm the 0xCC, and only then run on.
Stepping over a system call falls out for free. When the program
executes its int 0x80, the interrupt gate clears the Trap Flag on the
way into the kernel, so the debugger never descends into kernel code — and a
guard checks the privilege level of any #DB and ignores the ones that
didn’t come from the program. Step over a printf and you land neatly
on the next instruction, with the output already on screen.
A disassembler you can actually finish
A debugger wants to show instructions, not hex. A general x86 disassembler is a
notorious rabbit hole — but here’s the shortcut: the only programs being
debugged are output from our own compiler, which emits a small, fixed
set of instruction forms. So the disassembler only has to decode that subset.
Maybe fifty opcode patterns — mov, push/pop,
call, the arithmetic and compare forms, conditional jumps,
prologue/epilogue. Anything unrecognised is printed as db 0xNN so the
stream can never desync. A weekend’s worth of decoder instead of a career’s.
Backtrace from a stack frame
Because the compiler uses standard ebp frames, a backtrace is just
a pointer walk: the saved ebp and return address live at known
offsets, so you follow the chain until it leaves the program’s memory. Stop inside
a function call and you get exactly what you’d hope:
(dbg) bt
#0  0x0020001f      ← add()
#1  0x0020006e      ← main()
#2  0x002f0000      ← the exit stub
No names — the binary carries no symbols — but the structure is all
there: add called from main, which returns into the tiny
stub that ends the program.
What you can do with it
The command set is the familiar handful: r for registers,
x to examine memory, u to disassemble, b/
d for breakpoints, s to step, c to continue,
bt for a backtrace, q to quit. A program that faults, or
that you kill with q, hands you back a clean shell.
It’s machine-level — addresses and registers, not C source lines or
variable names. Source-level debugging would mean teaching the compiler to emit a
symbol and line table and loading it at runtime, which is a milestone of its own.
But the foundation is in place: a from-scratch operating system that can now stop,
inspect, and step its own programs, instruction by instruction.